How to Use a Standard Deviation Calculator (With Examples)
Standard deviation is one of the most important statistical measures used across various fields including finance, science, engineering, and data analysis. It tells us how spread out the values in a dataset are from the mean. In this comprehensive guide, we’ll explore how to effectively use a standard deviation calculator, understand the concepts behind it, and apply it to real-world examples.
What is Standard Deviation?
Standard deviation is a measure of how dispersed the data is in relation to the mean. A low standard deviation indicates that the values tend to be close to the mean, while a high standard deviation indicates that the values are spread out over a wider range.
The formula for standard deviation (σ) is:
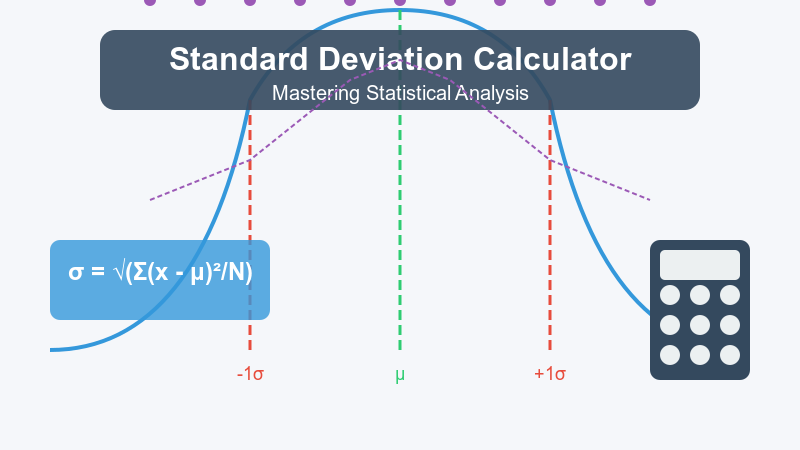
σ = √(Σ(x - μ)²/N)
Where:
- σ (sigma) is the standard deviation
- Σ means “sum of”
- x represents each value in the dataset
- μ (mu) is the mean of the dataset
- N is the number of values in the dataset
Types of Standard Deviation Calculators
1. Population Standard Deviation Calculator
Used when you have data for the entire population.
2. Sample Standard Deviation Calculator
Used when you have data from a sample of the population. It uses a slightly different formula with (n-1) in the denominator instead of N.
3. Online Standard Deviation Calculators
Many websites offer free calculators where you can input your data and get results instantly.
4. Spreadsheet Programs
Microsoft Excel, Google Sheets, and other spreadsheet software have built-in functions for calculating standard deviation.
5. Statistical Software
Professional tools like SPSS, R, and SAS provide more sophisticated options for standard deviation calculations.
How to Use a Standard Deviation Calculator
Step 1: Gather Your Data
Collect the numerical values you want to analyze. These could be test scores, financial returns, measurements, or any other quantitative data.
Step 2: Choose the Appropriate Calculator
Determine whether you need a population standard deviation (when you have all possible data) or a sample standard deviation (when you have a subset of data).
Step 3: Input Your Data
Enter your data into the calculator. Most calculators accept data in various formats:
- Comma-separated values
- Space-separated values
- One value per line
Step 4: Calculate and Interpret
After inputting your data, click “Calculate” or the equivalent button. The calculator will return the standard deviation along with other statistical measures like mean, median, and range.
Practical Examples
Example 1: Test Scores
Let’s calculate the standard deviation for a set of exam scores: 85, 90, 72, 95, 68, 88, 76, 92, 81, 79
Step-by-step solution:
- Input the data into the calculator.
- Calculate the mean: (85+90+72+95+68+88+76+92+81+79)/10 = 82.6
- For each score, find the difference from the mean, square it:
- (85-82.6)² = 5.76
- (90-82.6)² = 54.76
- And so on…
- Sum these squared differences: 5.76 + 54.76 + … = 770.4
- Divide by the number of scores: 770.4/10 = 77.04
- Take the square root: √77.04 = 8.78
The standard deviation is 8.78, indicating moderate variability in test scores.
Example 2: Stock Returns
Consider monthly returns (in percentage) for a stock: 2.3, -1.5, 3.2, 0.8, -0.5, 1.9, 4.2, -2.1, 0.3, 1.6, 3.5, -1.8
Using an online calculator:
- Input the data.
- The calculator returns a standard deviation of approximately 2.11%.
This means the stock returns fluctuate on average about 2.11 percentage points from the mean, suggesting moderate volatility.
Example 3: Height Measurements
Heights (in cm) of 15 students: 168, 172, 175, 180, 162, 170, 175, 168, 178, 185, 171, 173, 177, 165, 169
Using Excel:
- Enter the data in a column.
- Use the formula =STDEV.P(A1:A15) for population standard deviation or =STDEV.S(A1:A15) for sample standard deviation.
- The sample standard deviation is approximately 6.16 cm.
This indicates that the heights vary from the mean by about 6.16 cm on average.
Interpreting Standard Deviation
Small Standard Deviation
A small standard deviation means the data points tend to be close to the mean. For example, if students in a class have test scores with a small standard deviation, it suggests consistent performance across the class.
Large Standard Deviation
A large standard deviation indicates greater dispersion from the mean. For example, a mutual fund with a high standard deviation of returns is generally considered riskier than one with a low standard deviation.
The Empirical Rule (68-95-99.7 Rule)
For normally distributed data:
- About 68% of values fall within one standard deviation of the mean
- About 95% fall within two standard deviations
- About 99.7% fall within three standard deviations
Applications of Standard Deviation
1. Finance and Investment
Standard deviation is used to measure market volatility and investment risk. Higher standard deviation indicates higher risk.
2. Quality Control
Manufacturers use standard deviation to monitor production processes and ensure consistency.
3. Weather Forecasting
Meteorologists use standard deviation to understand the variability in temperatures, precipitation, and other weather patterns.
4. Education
Educators use standard deviation to analyze test scores and assess student performance.
5. Scientific Research
Scientists use standard deviation to determine the reliability of experimental results.
Common Mistakes to Avoid
1. Using the Wrong Type of Standard Deviation
Make sure you’re using population standard deviation for complete datasets and sample standard deviation for sample data.
2. Ignoring Outliers
Extreme values can significantly impact standard deviation. Consider whether outliers should be included or excluded from your analysis.
3. Misinterpreting the Results
Remember that standard deviation is in the same units as your original data. A standard deviation of 5 means something different for test scores (points) than for heights (centimeters).
4. Assuming Normal Distribution
Standard deviation is most informative for normally distributed data. For skewed distributions, other measures might be more appropriate.
Advanced Considerations
Coefficient of Variation (CV)
The CV is the ratio of the standard deviation to the mean, expressed as a percentage. It allows for comparison between datasets with different units or scales.
CV = (Standard Deviation / Mean) × 100%
Z-Scores
Z-scores tell you how many standard deviations a data point is from the mean:
Z = (x - μ) / σ
A z-score of 1 means the value is one standard deviation above the mean.
Variance
Variance is simply the square of the standard deviation and is sometimes used instead of standard deviation in certain statistical analyses.
Conclusion
Standard deviation is a powerful statistical tool that helps us understand the dispersion of data. Whether you’re analyzing financial returns, test scores, or scientific measurements, knowing how to calculate and interpret standard deviation will enhance your data analysis capabilities.
By using a standard deviation calculator correctly and understanding what the results mean, you can make more informed decisions based on your data. Remember that standard deviation is just one of many statistical measures, and it’s often most helpful when used alongside other analyses to gain a complete picture of your dataset.
Whether you’re a student, researcher, financial analyst, or just someone interested in understanding variability in data, mastering the use of standard deviation calculators is an essential skill in our data-driven world.