Standard Deviation vs. Variance: Key Differences Explained
In statistics and data analysis, understanding the spread or dispersion of data points is just as important as measuring central tendency. Two of the most fundamental measures of dispersion are variance and standard deviation. While closely related, these statistical tools serve different purposes and provide distinct insights into data distribution. This comprehensive guide explores their definitions, calculations, practical applications, and the key differences between them.
Understanding Measures of Data Dispersion
Before delving into the specifics of variance and standard deviation, it’s important to understand why measures of dispersion matter in statistical analysis.
While measures of central tendency (mean, median, mode) give us a representative value for our dataset, they don’t tell us anything about how the data points are distributed around that central value. This is where measures of dispersion come in they quantify the spread or variability within our data.
For example, consider two datasets with the same mean of 10:
- Dataset A: 9, 10, 11
- Dataset B: 1, 10, 19
Although both have the same central value, the spread of values differs dramatically a crucial distinction that only measures of dispersion can reveal.
What Is Variance?
Variance measures the average squared deviation of each data point from the mean. It effectively quantifies how far a set of numbers is spread out from their average value.
Variance Formulas
For a population:
σ² = Σ(X – μ)² / N
For a sample:
s² = Σ(x – x̄)² / (n-1)
Where:
- σ² or s² represents the variance
- X or x represents each value in the dataset
- μ (population) or x̄ (sample) represents the mean
- N (population) or n (sample) represents the number of observations
- Σ represents the sum across all values
Key Characteristics of Variance
- Always non-negative (cannot be less than zero)
- Expressed in squared units of the original data
- Gives higher weight to outliers due to the squaring operation
- Additive for independent random variables
- A variance of zero indicates all data points are identical
- Larger values indicate greater spread or dispersion
What Is Standard Deviation?
Standard deviation is the square root of the variance. It measures the average amount of deviation from the mean, providing a more intuitive measure of spread in the same units as the original data.
Standard Deviation Formulas
For a population:
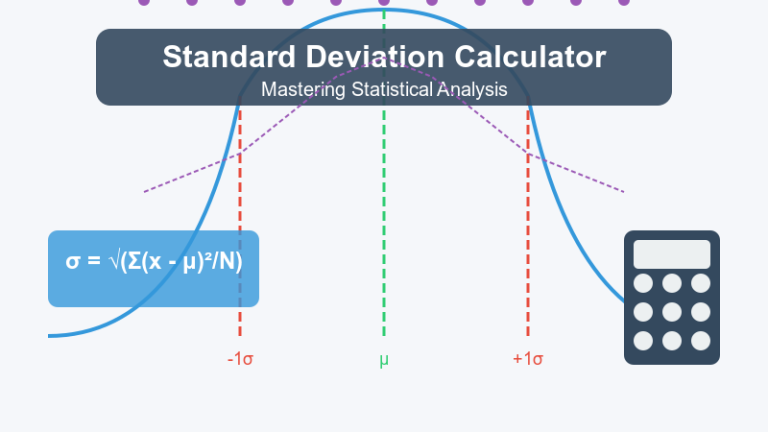
σ = √[Σ(X – μ)² / N]
For a sample:
s = √[Σ(x – x̄)² / (n-1)]
Key Characteristics of Standard Deviation
- Always non negative
- Expressed in the same units as the original data
- More directly interpretable than variance
- In normal distributions, approximately:
- 68% of data falls within one standard deviation of the mean
- 95% of data falls within two standard deviations of the mean
- 99.7% of data falls within three standard deviations of the mean (the “empirical rule”)
Calculating Variance and Standard Deviation A Step by Step Example
Let’s walk through a simple example to illustrate how both metrics are calculated.
Consider the dataset: 4, 8, 11, 15, 22
Step 1: Calculate the mean (x̄)
x̄ = (4 + 8 + 11 + 15 + 22) / 5 = 60 / 5 = 12
Step 2: Calculate deviations from the mean
4 – 12 = -8
8 – 12 = -4
11 – 12 = -1
15 – 12 = 3
22 – 12 = 10
Step 3: Square the deviations
(-8)² = 64
(-4)² = 16
(-1)² = 1
(3)² = 9
(10)² = 100
Step 4: Find the sum of squared deviations
64 + 16 + 1 + 9 + 100 = 190
Step 5: Calculate the variance (sample formula)
s² = 190 / (5-1) = 190 / 4 = 47.5
Step 6: Calculate the standard deviation
s = √47.5 ≈ 6.89
Using a probability calculator can simplify these calculations, especially for larger datasets where manual computation becomes tedious.
Key Differences Between Variance and Standard Deviation
Understanding the distinctions between these two statistical measures helps in selecting the appropriate metric for specific analytical needs:
1. Units of Measurement
Variance: Expressed in squared units of the original data. If your data is measured in meters, variance is in square meters.
Standard Deviation: Expressed in the same units as the original data (meters in our example).
This difference makes standard deviation more intuitive and directly interpretable in many practical applications.
2. Mathematical Properties
Variance:
- Additive for independent random variables (the variance of the sum equals the sum of variances)
- Changes by the square of the scaling factor (if all values are multiplied by k, variance multiplies by k²)
Standard Deviation:
- Not additive for combined variables
- Changes linearly with scaling (if all values are multiplied by k, standard deviation multiplies by |k|)
3. Interpretability
Variance: More abstract due to squared units, making it less intuitive to directly interpret.
Standard Deviation: More concrete and interpretable, representing a typical deviation from the mean in the original units.
4. Statistical Applications
Variance:
- Preferred in theoretical statistics and mathematical derivations
- Used in ANOVA (Analysis of Variance)
- Critical in risk assessment in finance
- Essential in machine learning for bias-variance tradeoff analysis
Standard Deviation:
- Preferred for data description and reporting
- Used for determining normal ranges in medical tests
- Applied in quality control to assess process consistency
- Used to establish confidence intervals
Practical Applications in Various Fields
Understanding when and how to apply variance and standard deviation enhances data analysis across numerous disciplines:
Finance and Investment
In portfolio management, variance helps quantify risk, while standard deviation is often reported as a measure of volatility or investment risk. Higher standard deviations in returns indicate greater risk.
Manufacturing and Quality Control
Standard deviation helps establish control limits for production processes, identifying when a process is operating abnormally.
Healthcare and Medicine
Medical researchers use standard deviation to establish normal ranges for various health metrics like blood pressure, cholesterol levels, and other vital measurements.
Environmental Science
Scientists use these measures to quantify variability in environmental data, such as temperature fluctuations, rainfall patterns, or pollution levels.
Education
Standard deviation helps assess the spread of test scores, indicating whether the difficulty level was appropriate and how student performance varied.
Limitations of Variance and Standard Deviation
Despite their utility, both measures have limitations:
- Sensitivity to outliers: Extreme values can significantly inflate both variance and standard deviation.
- Assumption of central tendency: Both measures are most meaningful when the mean is a good representation of the center.
- Non-robust: Unlike measures like interquartile range, they’re highly influenced by extreme values.
- Distribution shape: They provide limited information about the shape of the distribution (skewness, kurtosis).
Choosing Between Variance and Standard Deviation
Consider these factors when deciding which measure to use:
- Interpretability needs: If you need to communicate findings to non-specialists, standard deviation is usually more accessible.
- Mathematical requirements: Some statistical procedures specifically require variance in their calculations.
- Units of measurement: When working within the original units is important, standard deviation is preferable.
- Theoretical vs. applied work: Variance often features more prominently in theoretical statistics, while standard deviation is more common in applied work.
Conclusion
Variance and standard deviation are complementary measures that provide crucial insights into data dispersion. While variance offers mathematical advantages for theoretical work, standard deviation provides a more intuitive measure in the original units of the data.
Understanding the relationship between these measures that standard deviation is simply the square root of variance helps bridge theoretical statistical concepts with practical data interpretation. Both measures remain foundational tools in statistical analysis, data science, and probability calculations.
For complex statistical analyses involving these concepts, using specialized tools like online calculators can streamline calculations and ensure accuracy. Whether you’re analyzing financial risk, research data, or quality control metrics, mastering these fundamental concepts will enhance your analytical capabilities.